However, it does seem that if one makes handling improvements to the car, and keeps the front/rear balance to original neutral line, that it will tend to oversteer. This is in fact the set-up prefered by some for autocross, but can be rather dangerous for track and higher speed events with other vehicles around.
So, the chart can be useful for getting an initial ballpark set-up, but it is even more useful once you know the vehicle's set-up, how it feels, and where you would like it to go. I'll use my car as an example, but first a word about the information required.
To use this method, the following information is needed. It is not always easy to obtain, but it is important to get it. It is possible to ballpark with (semi-) published data. But much harder to make decisions without the actual numbers.
On the scales, the car weighed 3201 lbs. without driver, no spare tire
and 1/2 tank of gas. Of this 58% was on the front.
The car was initially set up with a 200 #/in torsion bars, a 1.125
Addco type sway bar, and 180 #/in rear springs. If the non-adjustable
bar was as about stiff as my new adjustable in the soft setting, I come
up with a roll resistance of 850 #/in. of which 72.9 % is done by
the front.
Total Roll Resistance = Front Roll Resistance + Rear
Roll Resistance.
Front Roll Resistance = Torsion bar rate * 2 + sway
bar rate * (distance of sway bar ends/front track)
Rear Roll Resistance= leaf spring rate*(distance between
spring perches/rear track)*2 + rear sway bar rate * (distance of sway bar
ends/rear track)
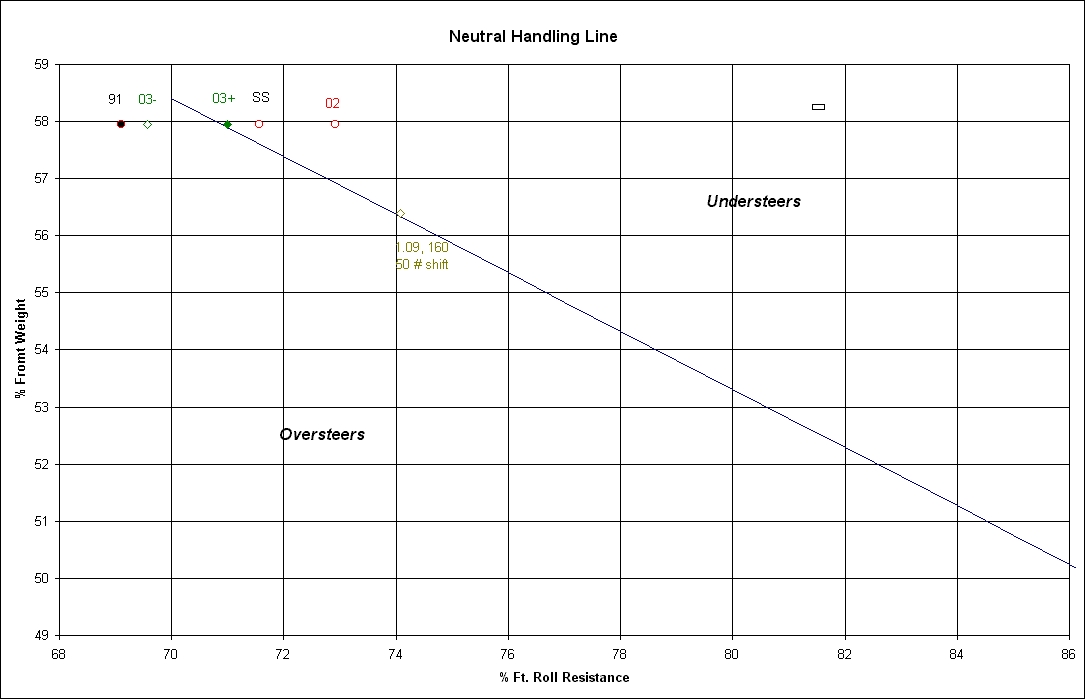
Now, I had also determined to reduce roll that I was now experiencing in autocross - in part due to the better tires and wheels, and maybe in part due to the weaker rear springs and use of the pinion snubber. To eliminate wheel hop and improve launch without the pinion snubber, I wanted an static load rear spring arch the same as my old springs had at the end of '02, but a lot stiffer spring. The Mopar Performance Super Stock Springs for the lightweight cars (2800#), might due the trick, but they are rated at 160 #/in or so we are told. Landum offered short track springs starting 1" lower than my old springs, but with a rate of 200#/in. Before going to custom springs, we plotted out the options.
Going with the Super Stock springs might have worked with the 247#/in torsion bars (1.09" dia.) if I could have moved 50 lbs off of the front and onto the rear. That change significantly shifts the weight percentage. Something close to that might be accomplisshed by moving the battery to the trunk. However, that is not an option at the moment as I don't have room for a trailer and need the trunk space to cary the tires and tools to the events. The other option with the Super Stock springs would have been to stick with the 200#/in torsion bars, but even on the softest sway bar setting, the balance would be slightly on the understeer side. However this remains a posible fall back position if the car proves twitchy. It is marked SS on the graph.
The plan for '03 is marked 03- and 03+ showing the range of adjustment
expected from the sway bar. It is based on using the 200#/in leafs
and the 247 #/in torsion bars. Also note that the chart shows that
the adjustment available from the sway bar is just about a half step change
in torsion bar size.
| Label | Torsion Bars | Leaf | Total Roll Rate | % Front Roll Rate |
| 91 (1991) | 1.03= 200#/in | 180 #/in | 897 | 69.1 |
| 02 (at end of 2002) | 1.03=200#/in | avg of 167+132 | 850 | 72.9 |
| SS | 1.03=200#/in | 160 #/in | 866 | 71.5 |
| 1.09, 50# Shift | 1.09=242#/in | 160 #/in | 950 | 74.1 |
| 03- | 1.09=242#/in | 200 #/in | 1012 | 69.5 |
| 03+ | 1.09=242#/in | 200 #/in | 1062 | 70.9 |
Spring Data
Most manufactures of torsion bars can give you the
spring rate, and since the motion ratio of a torsion bar is one, the wheel
rate is the same as the torsion bar rate. Mopar Perfomance supplies
torsion bars up to 1.14" dia. for A-bodies.
Finding spring rates for the sway bars and leaf
springs is more difficult. You can come up with a calculated number
for the sway bars and if you use Saner to make up your sway bar, he'll
do this for you. For the leaf springs, Chrysler has some data published,
but I have had no luck in finding suppliers who can do anything with the
OEM part numbers. The current p-part super stock springs are all
rated 160 #/in and I beleive that is spring rate, not roll rate.
Stock Barracuda Wt & Wt Distribution from Published Data.
1966 Barracuda S 3280 lbs.
56 % ft. (w/ driver) Road & Track
1966 Barracuda S 2820 curb, 3100 test
57 % ft. (w/ driver) Car & Driver
1967 NB 6 a/c 3280
curb, 3580 test, 58.9 %
Car Life
1967 FB 273 p/b 3310 curb, 3720 test,
54.9 %
Car Life
1969 FB 340 p/b p/s 3470 curb, 3650 test,
55.1 % (w/ driver) Car Life (car tested
w/ K-H alum. rims)
1969 FB 440
3405 curb, 3740 test, 57.2 %
(w/ driver) Car Life
1970 340 p/s p/b 3630 curb, 4020 test,
56 % (w/ driver)
Car Life
1970 AAR
3585 curb
56.1 %
Car Life
1972 340 p/s p/b 3520 curb
56.8 %
Car & Driver
Magazine articles all reprinted in Brooklands Books Plymouth Barracuda
1964-1974
There are some disparities as you can see, but it is a starting point
if you don't have scales.
My car was weighed at Englishtown (w/ 150 lbs. of tools) subtracting
the tools.
1967 NB 340 3240 lbs. and
reweighed in 2003 at 3201.
Lower curb wt. can be attributed to alum. intake, alum
water pump, manual steering, manual brakes. Car was weighed with
cast aluminum rims as well IIRC. all those items add up. fuel
level was prob 1/2 tank. The fastbacks may have slightly more weight
on the rear than the notchbacks.
A Priori [by testing] Roll Rate:
In 1992, we ran the car on a skid pad during an autocross. The
G-analyst measured roughly .82 G in the circle, and the two photographs
we took show roughly 4 degrees of body roll. Therefore total roll
rate was 5.5 to 6.6 degree/G.
In 2002, tests on a skidpad averaged 0.88 G steady state, but no pictures
were taken. The higher G can probably be attributed mostly to the better
tires and rims. Although an adjustable sway bar was installed, it was left
in the softest position, estimated at 299 lbs/inch.
'69 Formula S Set-up for comparison.
0.87" Torsion bar: 100 lbs/in. wheel rate
0.88" Sway Bar: 77 lbs/degree
Rear Leaf Springs: 132 lbs/in ride rate at wheel (not sure how to interpret
that)
revised April '03